The State-wide Indicators Framework (SWIF) provides regional NRM organisations with consistent methods and tools for collecting impact data. The framework includes smart systems for analysing this data and combining it to tell a compelling whole-of-Queensland story.
The SWIF database is the first of its kind for Australia’s natural resource management sector.
Developed by Penny Scott and NRM Regions Queensland’s Lee Blacklock in collaboration with regional NRM organisations and the Queensland Government, SWIF has this year delivered its first comprehensive, and impressive, State-wide dataset.
Thanks to the State-wide Indicators Framework we know that through NRIP funding alone, the sector has delivered 314,933 hectares of improved land condition and 158,167 hectares of improved vegetation condition. We have saved 31,230 tons of sediment from entering reef waterways each year, and planted 93,304 trees.
More about SWIF
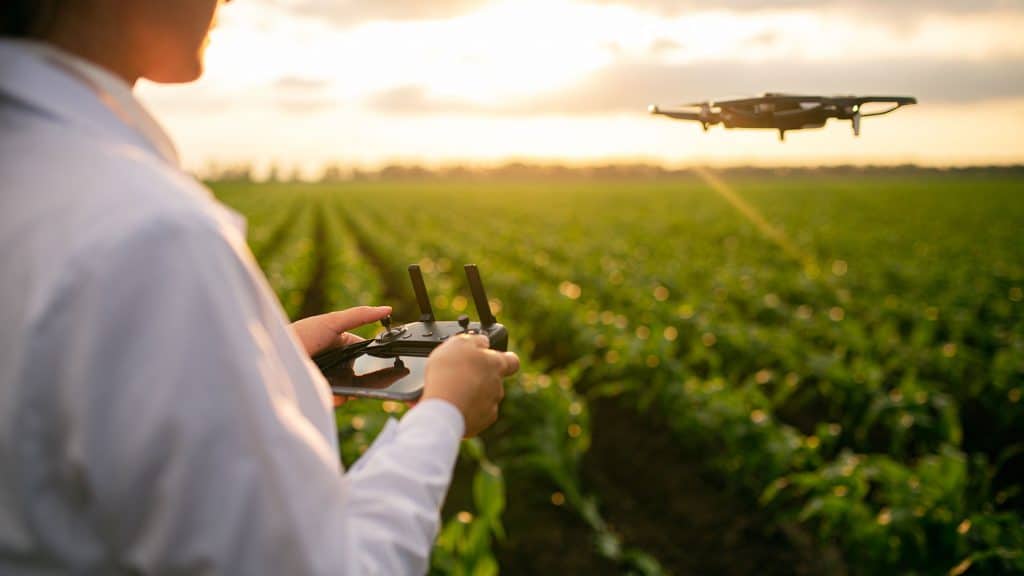
SWIF’s end-to-end system enables a project team member to collect monitoring data in the field using one of the SWIF apps. Some of those apps include the Land Condition Assessment Tool (LCAT) and the Wetlands Condition Assessment Tool (WetCAT), both developed by the Queensland Government in collaboration with the SWIF team. The Vegetation Condition Assessment Tool (VegCAT), a rapid assessment method based on the Queensland Herbarium’s BioCondition, was developed through SWIF. Grazing practice change data is collected according to standardised questions developed for the Paddock to Reef program. The SWIF has enabled this for regions that are not engaged in the Paddock to Reef program through the development of a simple Improved Grazing Practices App.
For project officers using these apps in the field, outcomes reporting is then largely complete! At reporting time, custom-built python script analyses monitoring data spatially, producing standardised files that are sent to NRM Regions Queensland for collation. This data is then aggregated into a State-wide dataset that feeds an interactive dashboard and provides results for the final NRIP Report Card.
Importantly, the detailed data is owned by the regions. This supports regional reporting and helps with continuous improvement.
2021-22 saw the finalisation of all tools as well as further development of the analysis systems, dashboards, visualisation tools and regional report templates. For the first time, our regional NRM sector is in a position to report – with credibility – the outcomes of investment.
Through NRIP funding alone, the sector has delivered 314,933 hectares of improved land condition and 158,167 hectares of improved vegetation condition. We have saved 31,230 tons of sediment from entering reef waterways each year, and planted 93,304 trees.
While several years in development, the SWIF system is now proven, and being used by all regional NRM organisations in Queensland.
Many regions are using it across their full project portfolio – not just NRIP. Word is spreading with considerable interest from other states as well as the Commonwealth Government and the Chief Scientist. The next phase will focus on consolidation and fine-tuning as well as seeking opportunities for scaling up the system, both in Queensland and beyond. Maximising alignment with other initiatives such as the Commonwealth Government’s long term environmental monitoring system will also be key to the longevity of the system.
Lee Blacklock is NRM Regions Queensland’s Manager Spatial Services. Having worked in natural resource management for more than 16 years, he says he’s thrilled to see the system working.
“No-one’s ever done it successfully before in a regional format like Queensland,” he said. “It’s good to see we can finally standardise data capture.”
The SWIF is made up of 5 components.
- The Program Logic – This defines what success looks like for all regions collectively. It describes the outcomes we will be measuring our progress against.
- The Data collection methods – these guarantee all regions are collecting consistent and credible data.
- Smart tools for collecting data – having custom made apps to collect the data makes everyone’s life easier.
- Smart tools for analysing and collating data – these tools analyse regional data and allow it to be combined statewide.
- Communication products – dashboards and report cards share the story of success as well as what we have learnt.
Explore the State-wide Indicators Framework here.

